关键是新一代sf主控太bt了,intel能否敌过?
openlock 发表于 2010-10-11 15:53
| Intel X25-M G2 (34nm) | Intel X25-M G3 (25nm) | |
| 代号 | Postville | Postville Refresh |
| 容量 | 80/160GB | 80/160/300/600GB |
| 闪存 | IMFT 34nm MLC | IMFT 25nm MLC |
| 4KB随机读/写性能 | 最高35K/8.6K IOPS | 最高50K/40K IOPS |
| 工作/闲置状态最高功耗 | 3.0/0.06W | 6.0/0.075W |
| 4KB随机写入寿命 | 7.5TB - 15TB | 30TB - 60TB |
| 掉电写入保护缓存 | 无 | 有 |
| 规格 | 1.8寸或2.5寸 | 1.8寸或2.5寸 |
| 安全性 | ATA密码 | ATA密码 + AES-128 |
| 连续读/写性能 | 最高250/100 MB/s | 最高250/170 MB/s |
| Intel X25-E (50nm) | Intel X25-E (25nm) | |
| 代号 | Ephraim | Lyndonville |
| 容量 | 32/64GB | 100/200/400GB |
| 闪存 | IMFT 50nm SLC | IMFT 25nm eMLC |
| 连续读/写性能 | 最高250/170 MB/s | 最高250/200 MB/s |
| 4KB随机读/写性能 | 最高35K/3.3K IOPS | 最高50K/5K IOPS |
| 工作/闲置状态最高功耗 | 3.0/0.06W | 5.0/0.095W |
| 4KB随机写入寿命 | 32GB: 1PB 64GB: 2PB | 100GB: 900TB - 1PB 200GB: 1PB - 2PB 400GB: 1.4PB |
| 掉电写入保护缓存 | 无 | 有 |
| 规格 | 2.5寸 | 2.5寸 |
| 安全性 | ATA密码 | ATA密码 + AES-128 |
关键是新一代sf主控太bt了,intel能否敌过?
openlock 发表于 2010-10-11 15:53
回复 nom8393 闪存颗粒这个绝对不是问题。没听说三星就不好,而且完全可以通过市场行为买到镁光-intel闪存
slr 发表于 2010-10-11 16:01
回复 nom8393
对你的说法我持完全相反的看法,卖闪存绝对是白菜价,INTEL对白菜没兴趣,目前来看卖的就是 ...
slr 发表于 2010-10-11 16:08
比x25-m快? 请找个测试吧 ~~~~ sf延迟大,因此单位时间iops测试里非常难看,我知道sf测评里吃亏,但是那成绩也太难看了吧,
寿命长我也喜欢`~~不过是牺牲了速度换来的,SF 是基于Linux/Unix服务器而来的,个人用不实用。
左岸 发表于 2010-10-11 17:08
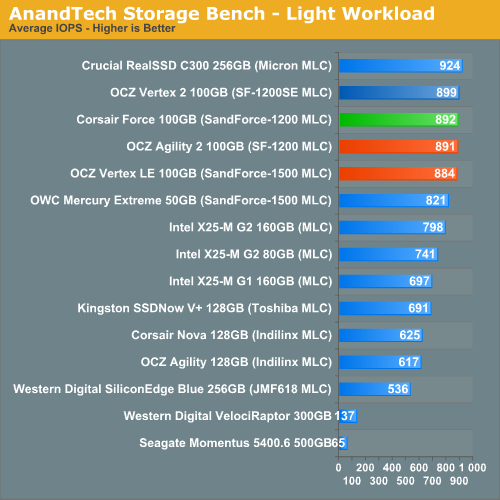
There’s some level of multitasking going on here but it’s not unreasonable by any means. Generally the application tasks proceed linearly, with the exception of things like web browsing which may happen in between one of the other tasks.
The recording is played back on all of our drives here today. Remember that we’re isolating disk performance, all we’re doing is playing back every single disk access that happened in that ~5 minute period of usage. The light workload is composed of 37,501 reads and 20,268 writes. Over 30% of the IOs are 4KB, 11% are 16KB, 22% are 32KB and approximately 13% are 64KB in size. Less than 30% of the operations are absolutely sequential in nature. Average queue depth is 6.09 IOs.
The performance results are reported in average I/O Operations per Second (IOPS):
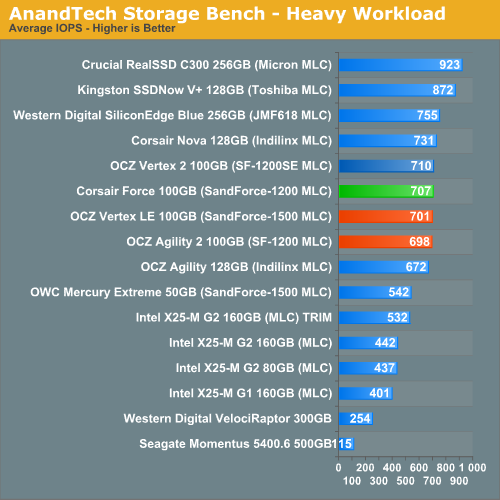
If there’s a light usage case there’s bound to be a heavy one. In this test we have Microsoft Security Essentials running in the background with real time virus scanning enabled. We also perform a quick scan in the middle of the test. Firefox, Outlook, Excel, Word and Powerpoint are all used the same as they were in the light test. We add Photoshop CS4 to the mix, opening a bunch of 12MP images, editing them, then saving them as highly compressed JPGs for web publishing. Windows 7’s picture viewer is used to view a bunch of pictures on the hard drive. We use 7-zip to create and extract .7z archives. Downloading is also prominently featured in our heavy test; we download large files from the Internet during portions of the benchmark, as well as use uTorrent to grab a couple of torrents. Some of the applications in use are installed during the benchmark, Windows updates are also installed. Towards the end of the test we launch World of Warcraft, play for a few minutes, then delete the folder. This test also takes into account all of the disk accesses that happen while the OS is booting.
The benchmark is 22 minutes long and it consists of 128,895 read operations and 72,411 write operations. Roughly 44% of all IOs were sequential. Approximately 30% of all accesses were 4KB in size, 12% were 16KB in size, 14% were 32KB and 20% were 64KB. Average queue depth was 3.59.
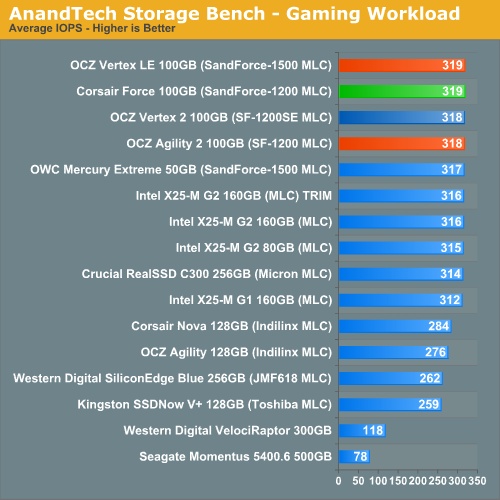
The gaming workload is made up of 75,206 read operations and only 4,592 write operations. Only 20% of the accesses are 4KB in size, nearly 40% are 64KB and 20% are 32KB. A whopping 69% of the IOs are sequential, meaning this is predominantly a sequential read benchmark. The average queue depth is 7.76 IOs.
我一直在强调sf就是适合重压力,这点毋庸置疑,sf的寿命也是顶呱呱,但是这些对个人用户有意义么 ...
左岸 发表于 2010-10-11 18:24
你不了解Intel的工厂实际状况。一般对于一个半导体工厂来说,利润最高的产品是Logical,也就是处 ...
nom8393 发表于 2010-10-11 16:16
看来是同道中人
我已经G3在手
盗版 发表于 2010-10-11 09:14 PM
看来是同道中人
我已经G3在手
盗版 发表于 2010-10-11 21:14
看来是同道中人
我已经G3在手
盗版 发表于 2010-10-11 21:14
 我关心的是价格...
这个问题好难辩得清,我等3年后再买,到时候的SSD技术应该已经很成熟…
phac123 发表于 2010-10-12 15:44
| 欢迎光临 POPPUR爱换 (https://we.poppur.com/) | Powered by Discuz! X3.4 |
