zifzhu9 s) V: `6 u/ y3 W7 y
' `4 s$ E: K' h* J; h. t. R" ]9 E1 |* u( |" ~) R
1 n1 L ]" l( g7 ^Joined: 26 Dec 2007. G8 j, {2 Y: ?% `+ E
Posts: 6' ^% n7 ~, ?6 r2 i1 r* Y
Location: Suzhou, China1 F' }- n* j$ q0 A" O! u
|  Posted: Wed Jan 23, 2008 5:54 am Posted: Wed Jan 23, 2008 5:54 am
* R& t8 X! S$ M: m z( _4 _- N) R) I Post subject: |   | | * G' t6 o$ b: X) e2 r' c
| lavrye wrote: | | cj wrote: | | zifzhu wrote: | Hard to believe this wave will be reconstructed after filtering. At least, the total amplitude is decreased. $ }9 b+ R, Y1 s+ ]
The harmonic contains the 'beat cycle'.
( U' Z# D6 n# \ |
% n& Z0 w; s6 H4 \Hard to believe...? OK, here you have it right before your eyes.  ' X7 b, g# U; ?' v3 s2 b ' X7 b, g# U; ?' v3 s2 b
I've used this same graph many times over the years. It shows the sample points of a 10kHz sine wave.
+ F& w+ Q6 f( ^In the upper wave lines are simply drawn between the sample points (Sound Forge).
9 v3 [- ?9 T8 |0 i7 r7 m* kIn the lower wave, Adobe Audition has correctly reconstructed the samples back to a sine wave. 1 C/ s( U2 v5 _" n% {% S6 ^
The sample values are exactly the same in both waves. * i1 q% |% o+ }+ {8 P- X3 f
C-J
$ ]; {3 Z0 B: N
( ]6 U; r) X1 l2 d0 m2 s/ ^, d# ` |
: ]! p1 x u5 M* R+ H. n% R1 U
$ H" f1 \/ q1 g$ v1 ^/ Q: W
/ Z, s) A6 D9 M7 N
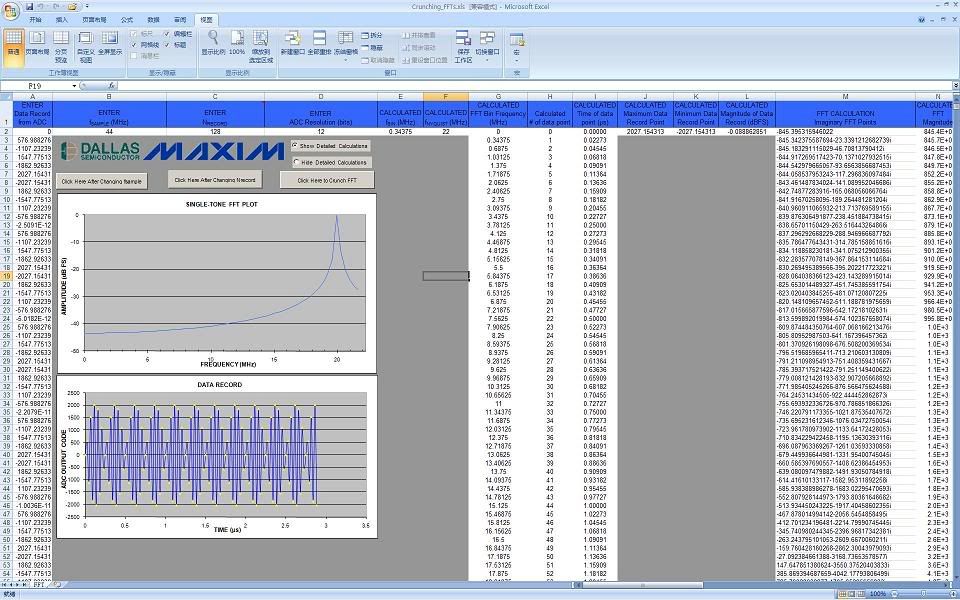
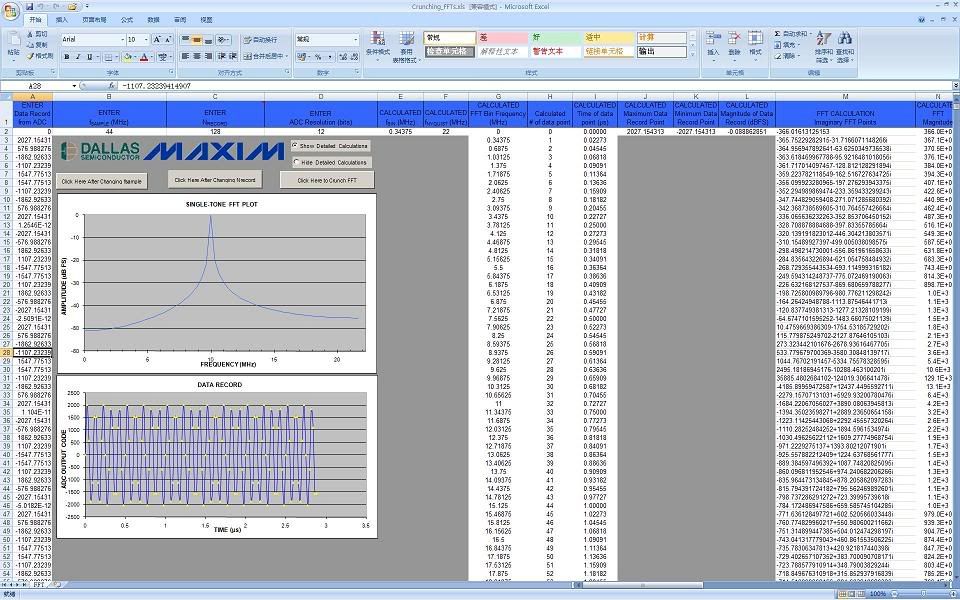
The Excel file shows the wave BEFORE FILTERING. I keep saying that we need to filter. It is very difficult to make a filter that will pass 22049Hz, and reject 22050Hz, but if you could do it, and if your file was much bigger then 44100 points (you would need a lot of "history"), your filtered wave would be a sine wave. R7 A. B( w( T9 U5 I0 {1 ^
]3 K* Q: u" r3 }- l, D# \No one seems to have a problem with say 1KHz sine wave. Why? Because it looks intuitivly (visualy) correct. The dots are "tracking" a sine wave shape so the process seems OK. At 1KHz, no one is questioning what happens to the signal between the sample points, and we all accept that the filter will "connect" the dots correctly. At 1KHz, look at one cycle and you see 44 points clearly on a sine wave....We did not need Nyquist to tell us that... # {3 R# K& p7 f: z/ q# J+ c) F S2 E
6 u" S0 Y/ l2 K. ]. G
So lets increase the frequency to say 5KHz. Now we have only about 9 points per cycle, and if you connect them with stright lines, it still looks "sort of" like a sine wave, but with some "sharp corners". You filter it and it becomes a sine wave - the "sharp corners" are smoothed out....
, n2 n) h" b7 z/ y4 S; E9 N. |8 w# a) v+ M/ f& M
CJ shows you the case of 10Kz, with about 4.5 points per cycle. Connect the dots with stright lines, and things are starting to look rather "non sinusoidal". At 15KHz it looks worse, that is when you connect with stright line. But filtering "brings back" the sine wave... 2 l5 K! m" f% E) G
; n& [$ {* x6 w8 A$ ~' m7 `4 jSay you start at 1Hz signal. The filtering is very easy - pass signals to 1Hz, reject signals at 22050Hz. 9 S4 z$ U1 o" z% [% [
/ J" R, t, A/ v5 V2 @) SRaise the signal 1Hz at a time and look at the required filter. At 1KHz, the filter needs to pass signals to 1KHz but block at 22050Hz. That is an easy filter, with a pass band of 1KHz and transition band of around 21Khz. At 10Khz, the filter gets tougher, the slope is about twice as steep, but still "doable". At 20KHz, you need a filter that passes 20KHz but blocks 22050Hz, that is a very steep filter - transition band to pass band ratio of 10:1. At 22049Hz the filter is so steep it would take a super computer to simulate... The transition to pass band ratio is 22049:1 5 C) ~, F/ m* O3 f! M. F: E
( o) {4 R; f/ F9 B# rThere is no "sudden" break at some "magic frequency". Why is 1Khz OK and 22049Hz not OK? Or is there a "sudden break" at say 19KHz? Why not 12KHz? The whole thing is gradual - as you increase the gradualy the tone frequency, you need to make the filter steeper...
8 x. h1 _* r5 S1 n' F1 u9 L& V/ D9 |+ o; B1 S! |" C
I said that one needs to look at a lot of history to steer the filter outcome to track the signal appropriatly. Your graph competly violated that, because connecting adjacent samples with a stright line completly discounts all the history except for a single previous sample. That is not how one filters a signal. You do need to filter the signal. 1 ^. `1 l5 D( ^* X
# ]9 @% ^% A1 u* Y
CJ's example is very good. Take a 10KHz sine signal and it looks "terrible", but when you filter it it looks like a perfect sine wave. Those that do not like math can use a scope to show it, and it will match the plot that CJ posted - the "strange" wave, when filtered, will become a clean sine wave.
4 I% v7 b. J" b( b" M! n
$ k( S# _8 e0 a9 EBetter yet, take a DA converter, a good one (with a filter). Run a 10KHz tone through it, the look at the output with a scope. It does not look like 4-5 dot per cycle connected by a stright line. It looks like a clean sine wave!
) p4 \2 F: [2 v. Y2 ~8 E# D* ?) H# k' O: U! P, L
And before you point out that the DA is up sampled, I will remind you that up sampling makes a lot more sample points (samples) out of the few original sample point by a process no other FILTERING. 1 Y0 E# K( m* M9 y) a b+ l! x/ ]
$ L& c% `+ K- |. Q4 f3 @Regards
4 s. a: P" Z0 X" i+ Q1 X/ @ CDan Lavry |
8 ^. h: V! f" f z! M9 F7 N, XHi Dan,
4 l+ \, o- d- o! ~. i, T& iI think the problem is the harmonic contains not only higher frequency but also lower frequency, that is not able to be filted by a low pass filter. As my previous post, the higher sample rate can get a cleaner lower frequency.
% Z1 l9 I" G. q0 a2 q& D9 |5 h8 d: G
There is no PERFECT sampling. The higher sample rate loss less information. Nyquist frequency is just a point that avoid aliasing that means samples the freqency correctly, not perfectly.* J, @9 q6 S0 x: F, y% W4 T! o
_________________
+ X: x% ^) Y. l' L* t' x |
|
 3 L8 l( Z+ e0 w! F3 U( U- g
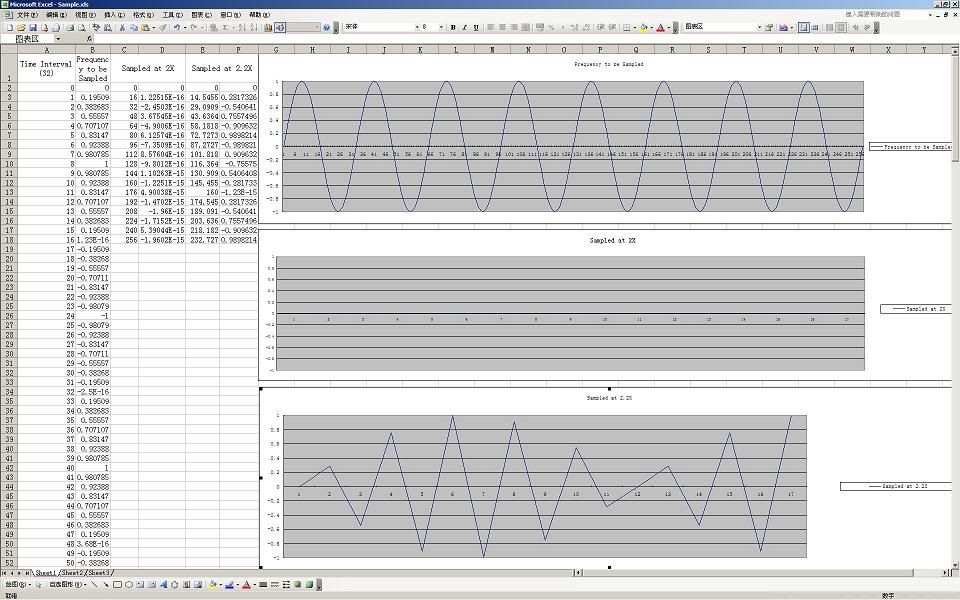

 / E. k6 s, @3 x) ^